Monday, 26 October 2026

How Circuit Variety Shapes NASCAR Cup Road-Course Win Records

Driver wearing sunglasses, a green cap and a green-and-white AMP racing suit waves beside stock cars, with a crowd behind him.

Circuit concentration versus broader track diversity

Historical tallies of road-course victories reflect distinct eras of NASCAR scheduling as much as individual venue mastery. According to an Oval Insider ranking published on June 30, 2026, Jeff Gordon stands atop the win column with nine victories, divided between Sonoma and Watkins Glen. Tony Stewart follows with eight, drawing from those same two tracks. Earlier eras featured Riverside as the primary road-course fixture, allowing Bobby Allison to take all six of his listed wins there, while Darrell Waltrip secured all five of his road victories at the same circuit.

More recent schedules expanded the variety of layouts, altering how drivers build their numbers. Shane van Gisbergen accumulated eight wins across five distinct venues, including the Chicago street course, Autódromo Hermanos Rodríguez, the Charlotte Roval, Sonoma, and Watkins Glen. Chase Elliott reached seven victories across five tracks without recording a win at Sonoma, earning triumphs at Watkins Glen, the Charlotte Roval, Circuit of the Americas, Road America, and Daytona's road course.

Preserving ties across the leading records

Because win totals frequently group multiple competitors together, defining the top 10 NASCAR Cup Series drivers with the most road course wins requires listing 11 names to avoid breaking ties artificially. Behind Gordon, Stewart, van Gisbergen, and Elliott, four drivers share fifth position with six victories each: Allison, Kyle Larson, Ricky Rudd, and Rusty Wallace.

A three-way tie at five wins rounds out the ranking, shared by Tim Richmond, Waltrip, and Martin Truex Jr. While Richmond built his tally at Riverside and Watkins Glen, Truex achieved his through victories at Sonoma and Watkins Glen. Counting street circuits alongside traditional road layouts ensures every non-oval victory documented in the June 2026 snapshot is preserved across the record.

Official reference: NASCAR official road-course winners list.

How Handling Trouble Nearly Cost Gordon Johncock the 1982 Indy 500

Open-wheel racing cars spread across the Indianapolis main straight beside crowded grandstands and a flag stand.

A Shrinking Lead Under Green

While late-race yellow flags and restart shootouts generated most of the top 10 closest finishes in Indianapolis 500 history, the 1982 contest between Gordon Johncock and Rick Mears followed a very different mechanical pattern. Instead of a bunched pack sprinting across the line, that race was shaped by a mechanical handling deficit eroding a seemingly secure advantage in the closing stages.

Johncock rejoined the track after his final scheduled pit stop holding a lead of more than 11 seconds. Soon after, a developing handling issue began hurting his pace, allowing Mears to rapidly erase the deficit over the final circuits. Mears drew close enough to mount an attack down the front straightaway on the 200th lap, but Johncock managed to withstand the pressure and cross the yard of bricks just 0.160 seconds ahead.

Flag Conditions and Margin Records

The 1982 duel demonstrates how car behavior over a sustained run can create high drama without the intervention of pace-car bunching. Timing data published by The Sports Cast places Johncock's 0.160-second survival among the tightest green-flag finishes in race history.

Accounting for race conditions remains critical when evaluating historical intervals. Green-flag records exclude outcomes decided while circulating behind the safety car, such as the 0.0295-second gap recorded in 2012 or the 0.0577-second margin logged in 2020. Under continuous green conditions, surviving a deteriorating car to the checkered flag requires managing the mechanical degradation just enough to reach the stripe first.

Official reference: INDYCAR official 2026 Indianapolis 500 event and results.

Why Pit Lane Speed Violations Depend on Timing Segments Rather Than Radar

Red No. 57 Chevrolet racing truck on pit road, with crews and pit equipment behind it.

Segment Averages Over Point Measurements

Pit road speed enforcement in NASCAR relies on timing cars between embedded pavement loops rather than checking instant velocity with a radar gun. Understanding how NASCAR measures pit road speeding between timing lines shows that officials calculate an average speed by dividing the known distance between consecutive loops by the elapsed time registered by each car's transponder. Because the measurement applies to an entire individual segment, brief throttle bursts do not trigger penalties on their own if slower running within that same stretch keeps the calculated average below the allowed threshold.

Drivers monitor engine tachometers to gauge their road pace, but an instantaneous dashboard reference does not mirror the elapsed segment average logged by timing scoring. Furthermore, each segment stands alone. Time spent stationary during service lowers the calculated average only for the specific interval encompassing the pit stop, meaning a long delay does not provide a buffer or offset speeding once the car crosses into the next scoring zone.

Line Spacing and Threshold Tolerances

The physical layout of scoring lines plays a significant role in how sensitive measurements become. Shorter timing segments leave drivers smaller margins for error, as momentary acceleration consumes a higher proportion of total travel time and skews the segment average upward. Consequently, NASCAR has added timing lines across various tracks to reduce box-position advantages and maintain consistent oversight across the lane.

Enforcement guidelines also distinguish the posted track limit from the actual violation threshold, which typically incorporates a tolerance of approximately 5 mph. While this buffer accommodates minor variations, drivers must balance vehicle acceleration against timing-line markers to avoid exceeding the calculated threshold before reaching the pit exit.

Official reference: NASCAR explanation of pit-road timing lines and speed enforcement.

Sunday, 25 October 2026

How Time Penalties Decided the First FIA Esports European Hill Climb Cup

Moritz Löhner with folded arms above a turquoise-and-white GT car, with Dörr Esports and ADAC Esports champion branding.

Knockout format and barrier penalties

In October 2026, the inaugural FIA Esports European Hill Climb Cup brought eight qualifying sim racers to Luxembourg for a live knockout tournament on RaceRoom. Competitors drove the Judd V8-powered BMW 134 up a virtual recreation of the 5.5-kilometre Glasbachrennen hill climb, an unfamiliar layout that was only revealed to drivers on the morning before the Sunday heats. The venue featured tight chicanes and similar-looking turns alongside a strict contact rule that assessed a five-second penalty whenever a car struck the course barriers.

Precision proved decisive in the single-run championship decider, where Moritz Löhner beats Abi Nakhle to claim the inaugural title. Sami Joe Abi Nakhle had shown exceptional speed by setting the virtual course record during his semi-final, but he accumulated two barrier contact sanctions in the final. Those infractions added ten penalty seconds to his run, though the governing body did not publish the exact run times or final gap.

Tournament progression and qualifying scale

Reaching the final required navigating multiple multi-run heats. Löhner advanced through a 2-1 quarter-final against Filip Floristeanu and a 3-0 semi-final over Turkka Häkkinen. Abi Nakhle took a 3-0 quarter-final win over Mihai-Alexandru before defeating Alessandro Ottaviani 2-1 in the semi-finals. Ottaviani subsequently secured third place overall by winning a single-run play-off against Häkkinen.

The eight finalists who gathered in Luxembourg emerged from a broad online qualification stage held between late August and early September 2026. According to the FIA, more than 7,000 drivers across 87 countries logged classified times during the open phase, demonstrating the global reach of the federation's new esports competition.

Official reference: FIA’s event report.

Desert Endurance Demands at the Qatar International Baja

Nasser Saleh Al-Attiyah’s white rally SUV crosses sandy desert terrain dotted with shrubs during the 2011 Qatar International Baja.

Demanding Stages Across Variable Desert Terrain

Cross-country rally events place severe mechanical strain on machinery across prolonged timed desert running. At the 2026 Qatar International Baja: 37-car competitors face an 860.05-kilometre itinerary that includes 541.24 kilometres of timed competitive stages following an initial 11.12-kilometre Prologue. Running vehicles at race pace through northern desert tracks and southern dunes subjects suspension assemblies, transmissions, and cooling packages to sustained high-stress cycles.

The opening selective section highlights this endurance test, measuring 336.45 kilometres across five timed sectors. Scheduled as the longest single stage in the 2026 World Baja Cup calendar, its sustained distance prevents crews from nursing marginal components, requiring vehicles to maintain continuous mechanical integrity before returning to service at Lusail.

Championship Implications Across Categories

Mechanical dependability across these selective sections directly shapes title battles in both the FIA World Baja Cup and the regional Middle East Baja Cup. World Cup leader Dania Akeel sits out the event after completing her six nominated rounds, leaving Mitchel van den Brink eight points adrift with an opportunity to overtake her standing if his car survives the distance.

A mechanical failure for pursuing contenders like Van den Brink, Francisco Barreto, or regional front-runner Nasser Saleh Al-Attiyah could immediately end title bids. In classes with sparse cup-registered entries, such as Stock and SSV, merely preserving the car across the rough 204.79-kilometre final stage in the southern dunes can secure critical championship points.

Official reference: FIA’s 2026 Qatar preview.

Saturday, 24 October 2026

How Formula 1 Circuit Elevation Changes Are Measured Across Major Tracks

A red Ferrari leads a dark Red Bull through a circuit corner beside red-and-white kerbing and grass.

Measuring Vertical Range Across a Grand Prix Lap

Grand Prix circuits vary widely in vertical movement, but published comparisons typically evaluate this characteristic using a single consistent metric. Rather than calculating the sum of every individual incline and decline around a lap, comparisons define vertical span as the net difference in height between a circuit's absolute highest and lowest points. For example, published comparisons of the top 10 F1 circuits with the biggest elevation changes place Belgium's Circuit de Spa-Francorchamps at the top with a 102.2-metre vertical range, followed by Austria's Red Bull Ring at 63.5 metres.

Gradient Distribution and Track Characteristics

A circuit's total vertical span does not mean a car faces a single continuous slope. At Spa-Francorchamps, the sharp compression and climb through Eau Rouge and Raidillon represent only part of the track's full 102.2-metre spread. Similarly, Sepang International Circuit spans 22 metres between its highest point at Turn 11 and its lowest at Turn 3, with undulating rises and falls distributed across the rest of the lap. Interlagos features a 43-metre drop between Turn 1 and Turn 5, Monaco spans 42 metres between Casino Square and the approach to La Rascasse, and Suzuka measures 40.4 metres from its low point between Turns 1 and 2 to its high point beyond Spoon curve.

Other layouts feature localized elevation differences that shape driver approaches without matching Spa's sheer scale. At the Circuit of the Americas, the steep uphill approach to Turn 1 assists braking, but the quoted 30.9-metre measurement represents the elevation rise starting from the lowest section between Turns 19 and 20 rather than from the starting grid. The Hungaroring (34.7 metres), Circuit de Barcelona-Catalunya (29.6 metres), and Baku City Circuit (26.8 metres) similarly demonstrate how vertical differences are spread across diverse natural valleys, hillsides, and city streets.

Official reference: Formula1.com’s circuit comparison.

How Late Race Long Lap Penalties Reshape MotoGP Results

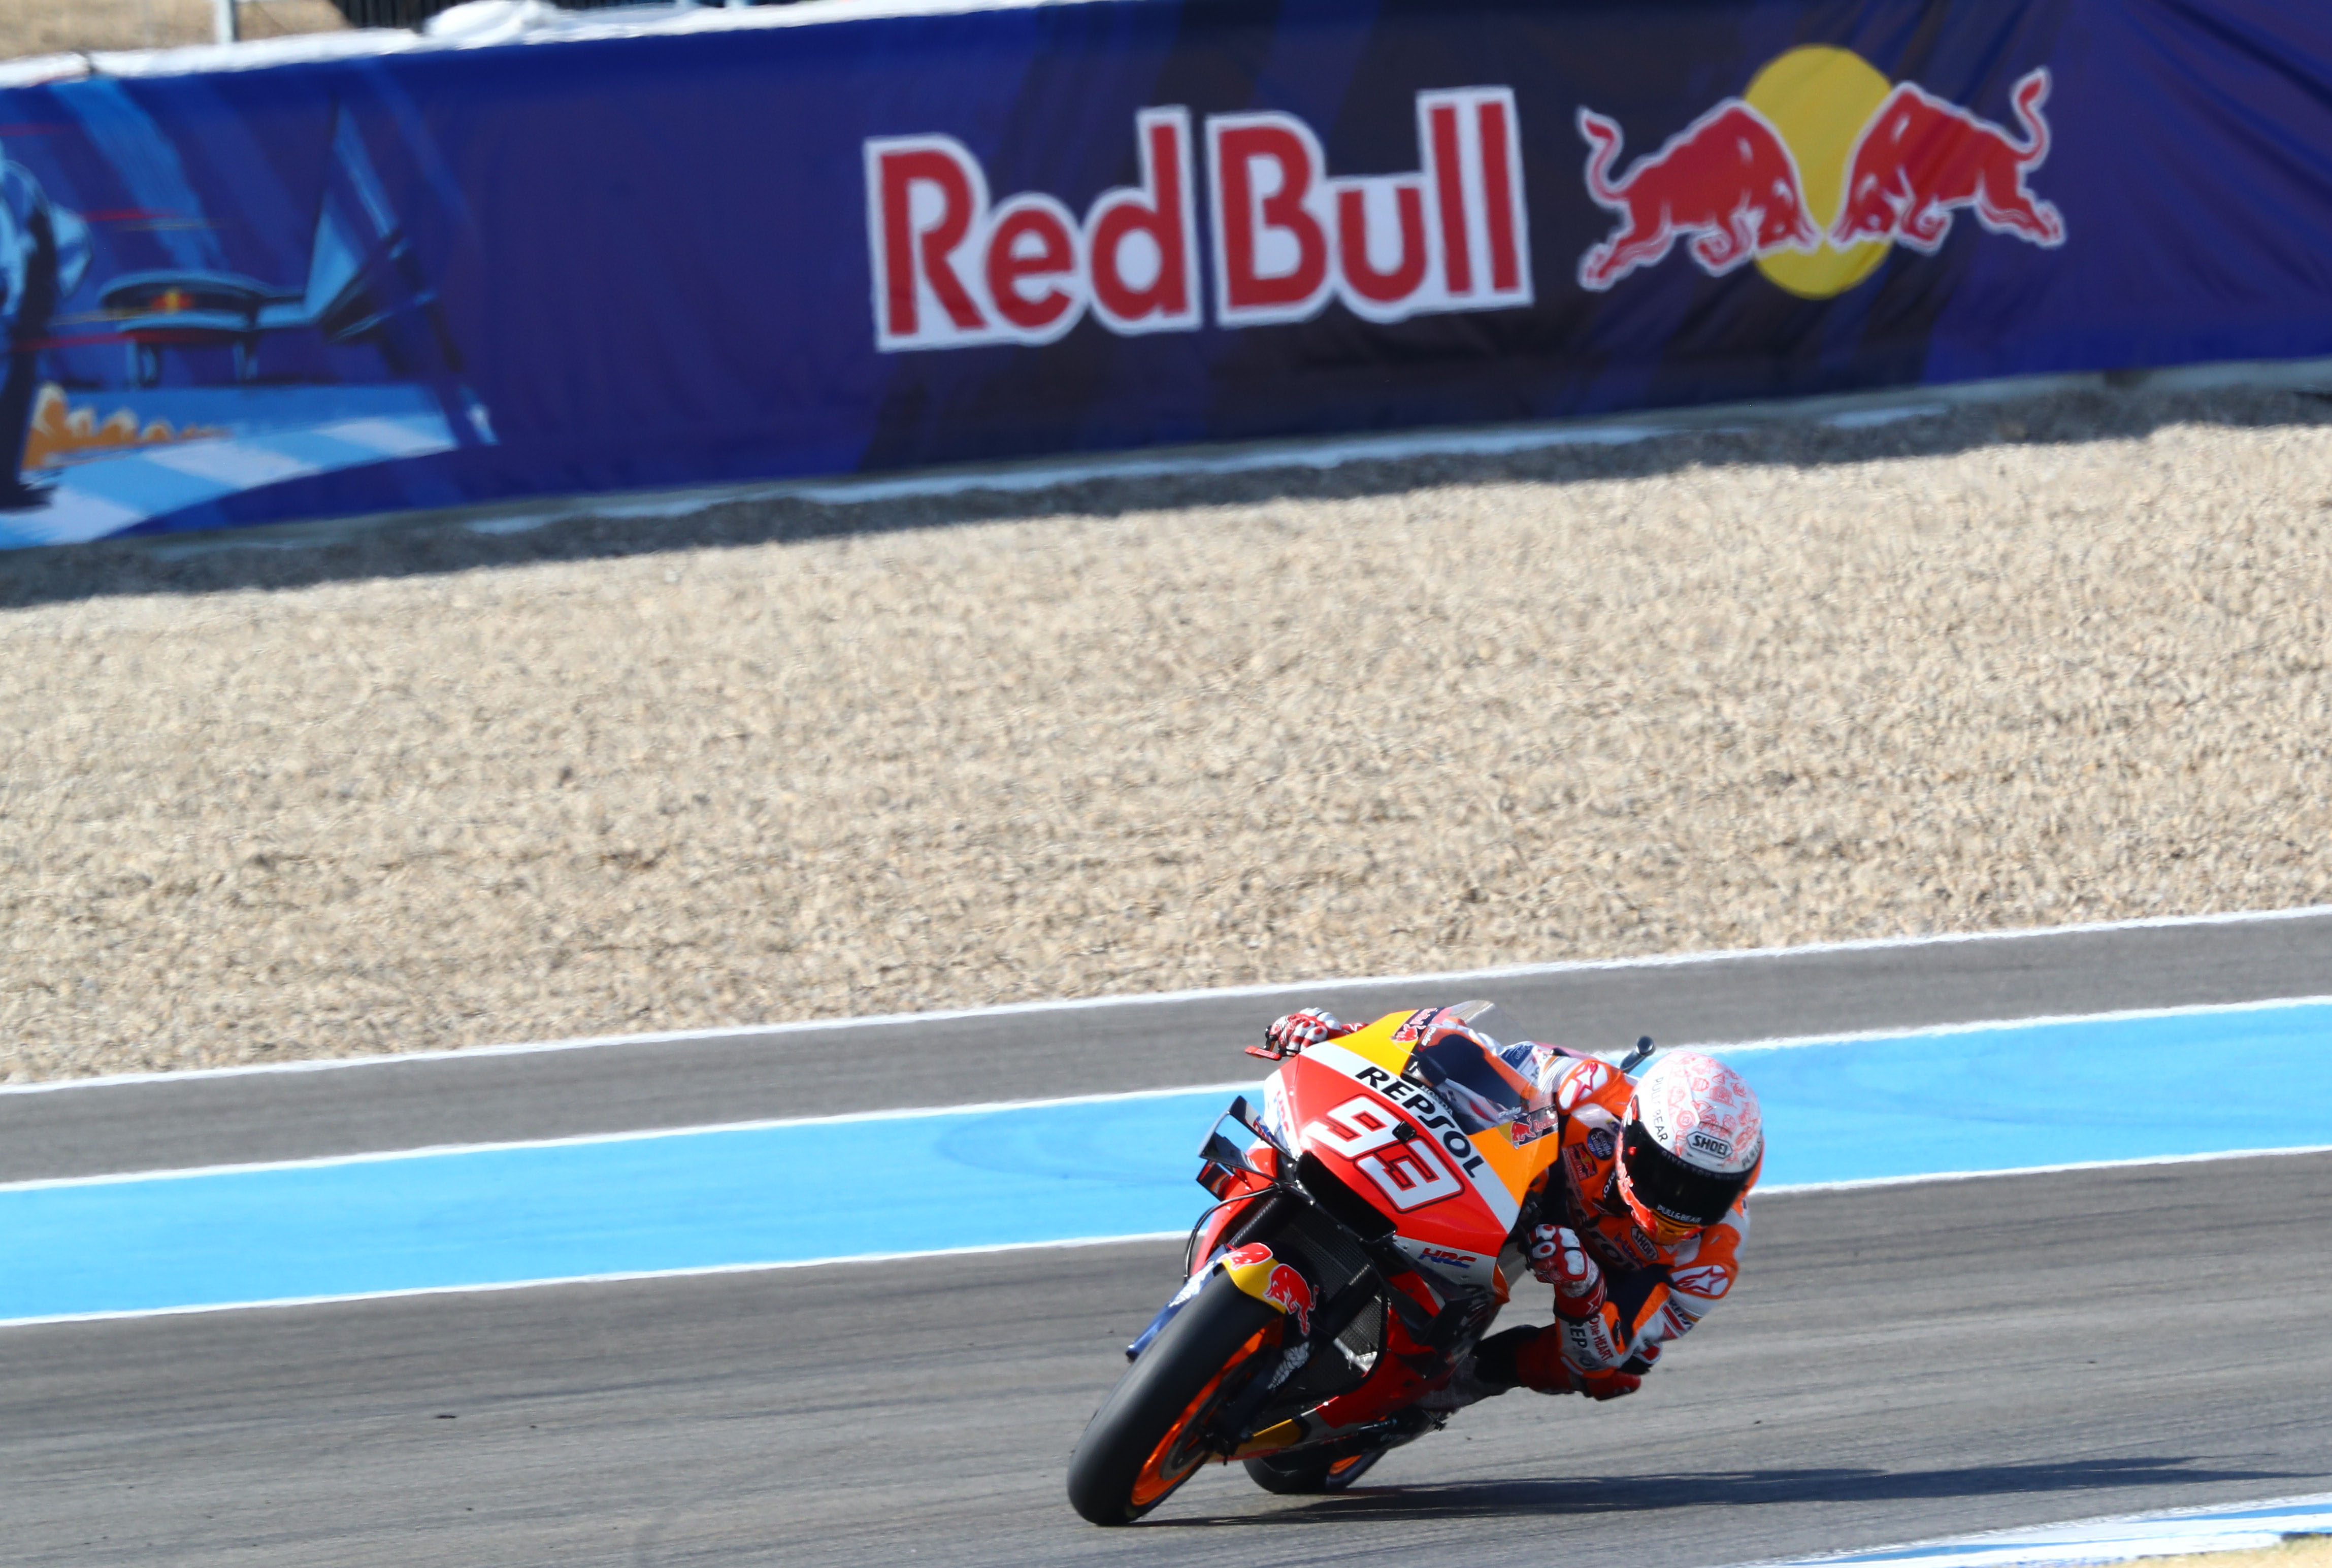
Rider leaning a Repsol Honda motorcycle numbered 93 through a corner, with blue runoff and gravel behind.

Post-Race Time Additions

During standard Grand Prix running, a rider instructed to serve a single Long Lap Penalty has a window of three laps from the time they first cross the finish line after receiving the dashboard notification. However, when an infraction occurs too late in the event to complete the designated loop, racing laps do not extend beyond the chequered flag. In explaining what happens if a MotoGP rider gets a long lap penalty on the last lap, the saved reporting clarifies that unserved penalties do not vanish at the finish line and are instead typically converted into time added directly to the final race duration.

This mechanism ensures that running out of remaining race distance is not treated as an intentional refusal to comply. While ignoring a penalty during live running escalates to harsher disciplinary steps such as a double penalty or a ride-through, an unserved loop at the chequered flag leads the stewards to apply the equivalent time penalty or select another sanction to settle the classification.

Circuit-Specific Conversions and Track Limits

The precise time added to a rider's final classification is not an arbitrary or uniform number. Details defining both the physical penalty route and its specific time equivalent are distributed to teams before opening practice begins, meaning the time addition varies from track to track rather than following a flat rate across the calendar.

Late-race track limits offences introduce an additional distinction in how finishing results are determined. If an infringement occurs on the final lap and is judged to alter a closely contested battle to another rider's clear disadvantage, stewards can mandate a direct post-race loss of position rather than calculating a time penalty.

Official reference: MotoGP's official track-limits guide.